Machine Learning
Origins of machine learning
- Machine learning has its origins in statistics and mathematical modeling of data
Fundamental idea of machine learning
- The fundamental idea of machine learning is to use data from past observations to predict unknown outcomes or values
Examples
An ice cream store owner using historical sales and weather records to predict daily ice cream sales
A doctor using clinical data to predict a patient's risk of diabetes
A researcher using past observations to automate the identification of penguin species
Machine learning model
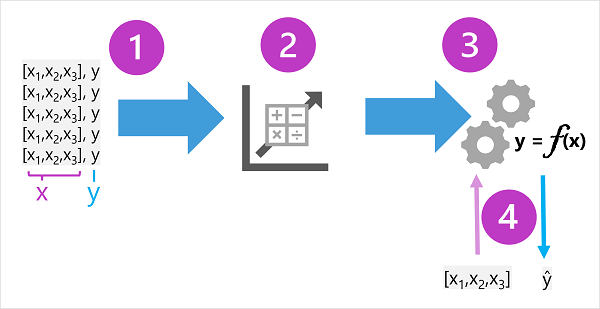
A machine learning model is a software application that calculates an output value based on input values
The process of defining the model's function is known as training
After training, the model can be used to predict new values in a process called inferencing.

Training data
The training data consists of past observations
Observations include the observed features and the known label
Features are often referred to as x, and the label as y
Examples
In the ice cream sales scenario, features (x) are weather measurements and the label (y) is the number of ice creams sold
In the medical scenario, features (x) are patient measurements and the label (y) is the likelihood of diabetes
In the Antarctic research scenario, features (x) are penguin attributes and the label (y) is the species
Algorithm and model
An algorithm is applied to determine a relationship between features and label
The result is a model that is a function denoted as f
The model is used for inferencing by inputting feature values and receiving a prediction of the label
The output from the model is often denoted as ŷ or "y-hat"
Types of machine learning

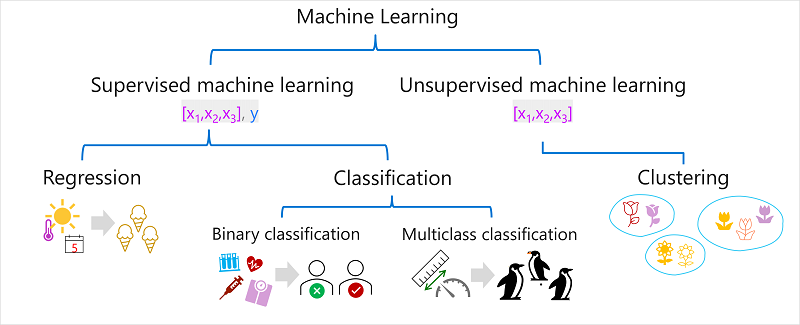
Supervised machine learning
Training data includes both feature values and known label values
Used to train models by determining a relationship between features and labels
Predicts unknown labels for features in future cases
Regression
Form of supervised machine learning with numeric label predictions
Predicts values like number of ice creams sold or selling price of a property
Classification
Form of supervised machine learning with categorical label predictions
Two common scenarios: binary classification and multiclass classification
Binary classification
Predicts one of two outcomes, true/false or positive/negative
Examples: risk for diabetes, loan default, response to marketing offer
Multiclass classification
Predicts one of multiple possible classes
Examples: species of a penguin, genre of a movie
Unsupervised machine learning
- Training data consists only of feature values without known labels
Clustering
Most common form of unsupervised machine learning
Identifies similarities between observations based on features and groups them into clusters
Examples: grouping flowers, identifying similar customers
Segmenting Customers:
- Segment customers into groups
Analyzing Customer Groups:
Identify and categorize different classes of customers
Examples of customer classes could include high value-low volume customers, frequent small purchasers, etc.
Labeling Clustering Results:
- Use categorizations to label observations in clustering results
Training a Classification Model:
Utilize the labeled data to train a classification model
The model will predict which customer category a new customer might belong to.
Regression
Training a Regression Model
Regression models are trained to predict numeric label values based on training data
The training data includes both features and known labels
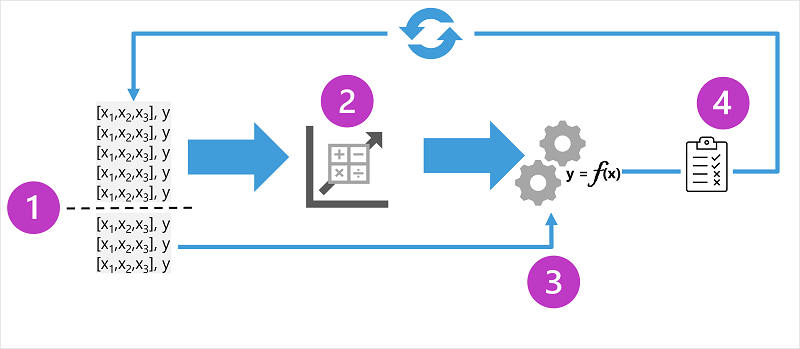
The training process involves multiple iterations
An appropriate algorithm is used to train the model
The model's predictive performance is evaluated
The model is refined by repeating the training process with different algorithms and parameters
The goal is to achieve an acceptable level of predictive accuracy
Key Elements of the Training Process
Splitting the training data to create a dataset for training the model and another subset for validation
Using an algorithm (e.g., linear regression) to fit the training data to a model
Using the validation data to test the model by predicting labels for the features
Comparing the predicted labels with the actual labels in the validation dataset
Calculating a metric to indicate the accuracy of the model's predictions
Example of Regression
Training a model to predict ice cream sales based on temperature as the feature
Historic data includes records of daily temperatures and ice cream sales.

Mean Absolute Error (MAE)
The mean absolute error (MAE) measures the average absolute difference between predicted and actual values.
In the ice cream example, the MAE is calculated by finding the mean of the absolute errors (2, 3, 3, 1, 2, and 3), resulting in a value of 2.33.
Mean Squared Error (MSE)
The mean squared error (MSE) measures the average squared difference between predicted and actual values.
It amplifies larger errors by squaring individual errors and calculating the mean of the squared values.
In the ice cream example, the MSE is calculated by finding the mean of the squared absolute values (4, 9, 9, 1, 4, and 9), resulting in a value of 6.
Root Mean Squared Error (RMSE)
The root mean squared error (RMSE) is calculated by taking the square root of the MSE.
In the ice cream example, the RMSE is calculated as the square root of 6, resulting in a value of 2.45 (ice creams).
Coefficient of determination (R2)
The coefficient of determination (R2) measures the proportion of variance in the validation results explained by the model.
R2 values range between 0 and 1, with higher values indicating a better fit.
In the ice cream example, the R2 calculated from the validation data is 0.95, indicating that the model explains 95% of the variance in the data.
Iterative training
In real-world scenarios, data scientists use an iterative process to train and evaluate models.
This process involves varying feature selection, algorithm selection, and algorithm parameters to improve model performance.
Selection of the best model
The model that results in the best evaluation metric is selected
The selected model should have an acceptable evaluation metric for the specific scenario.
Binary classification
Classification in machine learning
Classification is a supervised machine learning technique
It follows an iterative process of training, validating, and evaluating models
Binary classification
Binary classification predicts one of two possible labels for a single class
It often uses multiple features (x) and a y value of 1 or 0
Example - binary classification
In a simplified example, blood glucose level is used to predict diabetes
The model predicts whether the label (y) is 1 (diabetes) or 0 (no diabetes)
Training a binary classification model
To train the model, we use an algorithm to fit the training data to a function that calculates the probability of the class label being true (diabetes)
The probability is measured between 0.0 and 1.0, where 1.0 represents a high probability of having diabetes
The function describes the probability of the class label being true for a given value of x
Three observations in the training data have a known class label of true (1.0), and three observations have a known class label of false (0.0)
An S-shaped curve represents the probability distribution, where values above the threshold predict true (1) and values below predict false (0)
The threshold is defined at a probability of 0.5
By applying the function to new data, we can predict the class label (diabetes) based on the probability output